Supermetrics can be an incredibly useful tool for both account management and client reporting. It’s a very time efficient way to compile all your marketing data into Google Sheets, and monitor performance at a glance. In this article I’m going to run through the why and how of Supermetrics.
I began using Supermetrics about 2 years ago, for a variety of reasons:
- Needed one place I could view all my marketing campaign results (Bing Ads, Facebook Ads, and of course, AdWords). Why? Because loading each platform individually is painfully slow. When you factor in time taken to setup the correct data view you want.
- Wanted to be able to define a number of different views simultaneously. Specifically the current months performance + year to date performance. All while comparing with YoY data to see long term performance trends. This important to business owners when they are seeking to get growth in their business.
- Lastly, not only would this data be useful for at a glance performance management, I wanted to use it for reporting purposes also.
Table of Contents
Intro to how Supermetrics works
Supermetrics runs within Google Sheets, and allows you to pull data from all the top ad platforms. You can pull the data in a variety of formats:
- Specific time periods
- Compared with YoY metrics
- Using filters to track specific campaigns or data segments
And then you can manipulate the data in whatever way best suits your metrics. Using all the regular spreadsheet tools you’re used to (formulas, conditional formatting, pivot tables, etc)
The “cool” thing about Supermetrics running within Sheets as opposed to Excel, is that you can schedule sheets to update at multiple times during the day. That way, when you check your metrics, they’re never far from the real-time data. Which wouldn’t be possible if the plugin used regular Excel.
Who’s it for?
Supermetrics is for those who want to pull ad data from multiple sources (AdWords, Bing, Facebook etc) and be able to view the metrics all in one place. You could be an individual who likes to keep strict tabs on his performance, or you could be an agency managing multiple accounts, and wants to save time and streamline account analysis and reporting.
You can certainly replicate this kind of thing manually, but it comes at a time cost that may be unacceptable.
Integrations available:
So far I’ve only used 3 integrations (Google Ads, Facebook & Bing), but there are much more available. The main ones being:
- Google Ads
- Facebook Ads
- Bing Ads
- Google Analytics
- YouTube
- DoubleClick
- Twitter Ads
- Stripe
- Mailchimp
- Moz, SEMRush, Yahoo Gemini
And its this flexibility, that makes it a swiss army knife for crunching numbers, building dashboards and doing reporting.
How it works within Google Sheets
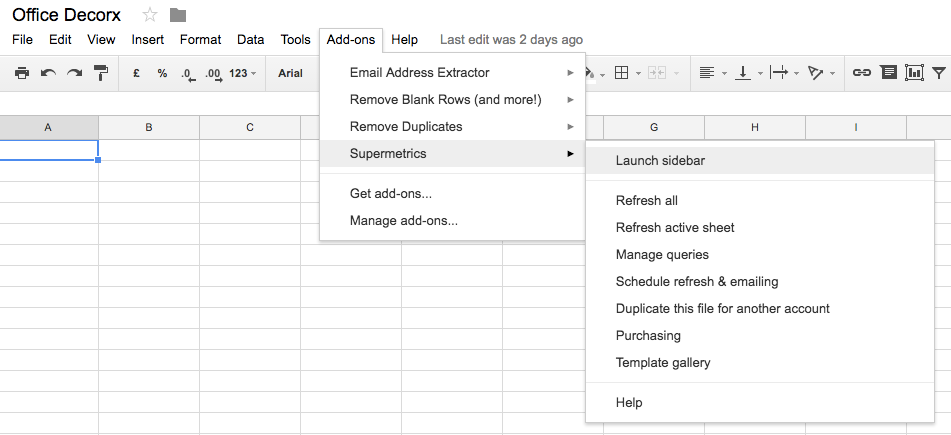
To install the add on for Google Sheets, navigate to the Supermetrics site, and hit the red “try for free” button. This will take you to the Chrome web store, where you can install the plugin. Once installed, you will see Supermetrics as an option within Add Ons:
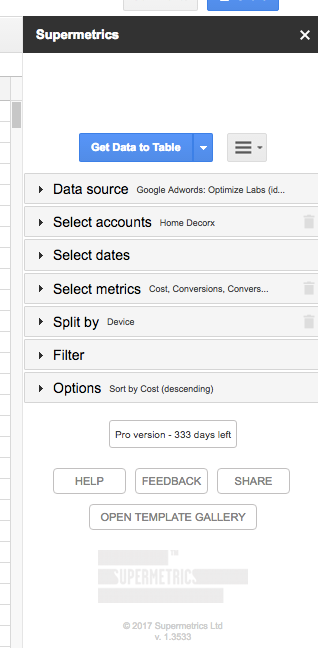
There’s a few options in here. The one we want to kick things off is Launch Sidebar. Click that, and you’ll see a sidebar that looks like the following:
And its this dialog box that gives you the options to configure how you display data. To get something really useful, you need to setup a number of different tables for data. That allows for different time periods and data sources.
Here’s an example of the Supermetrics workflow:
How I use it for eCommerce PPC reporting
Here is an example of a dashboard that I use for an eCommerce client. Its a reasonable demonstration of how much data is being pulled and manipulated. Rather than pulling directly from Supermetrics into this spreadsheet, I pull into separate sheets for each data source (to keep things “clean”), and then reference those cells in this sheet.
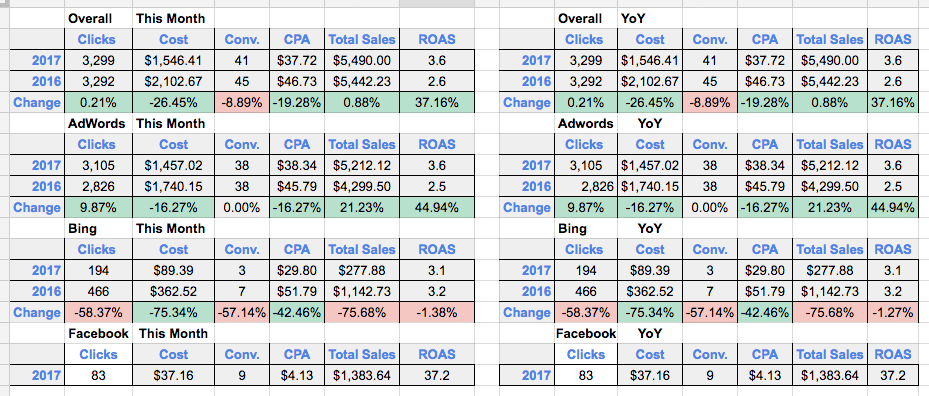
Example Supermetrics Dash. Worth noting that the green/red highlighting isn’t a SM feature, instead you can achieve this through ‘conditional formatting’ built into Sheets.
Supermetrics Templates Gallery
The above example is very specific to a certain type of client with certain types of goals (YoY eCommerce growth). However, for example with a lead generation campaign, you might build something quite different.
In addition to building reports from the ground up, you can also construct them from Supermetrics’ template gallery. You simply select the template you want to use, add your data source (AdWords, Facebook or Bing), and the view gets dynamically built out in seconds.
These can be seen as a “step 1” if you’re unsure where to begin with Supermetrics. Or for more advanced users, it can be a time-saving feature to access greater reporting granularity.
The below video demos a few of the templates I’ve found useful:
Supermetrics Alternatives?
Initially when Supermetrics was released it was a free tool, and has gradually become more expensive. At the latest renewal period I took a look around to see if there was a better (perhaps more affordable?) alternative.
When I started looking into the alternatives, I noticed that most work within a web interface, rather than through a spreadsheet. This has its pros and cons. The pros hinge largely on the ability to provide great visualisations of data. Nice graphics and colors for example. The cons relate largely to customisation. Whilst it’s possible to have infinite customisation within a web interface, the practicality thus far was that they’re mostly limited to a fixed set of configurations.
Personally I need to be able to customise the data that’s being shown. For example, with some clients they have legacy conversion data that is inaccurate (from issues with conversion tracking pixels), so I need to be able to make manual adjustments such that their data is accurate. And there further examples I could go into where the flexibility of spreadsheets is v. much welcomed.
There was one alternative, called Analytics Edge, that works within a spreadsheet. My issue with this one was that it uses Excel, rather than Google Sheets. The upside to using a cloud based System like sheets, is that you can set it to auto-refresh at different points during the day/night. That way, when you open the sheet, the data is already relatively up to date.
So with this in mind, I’ve just included a cursory overview of the alternatives below:
As mentioned above, Analytics Edge is an Excel plugin similar to Supermetrics. Its $75 per year, with an extra $50 for each “connector”. It offers connectors such as Bing, AdWords, Facebook and more. Whilst relatively cheap from the offset, it can add up if you require a lot of connectors.
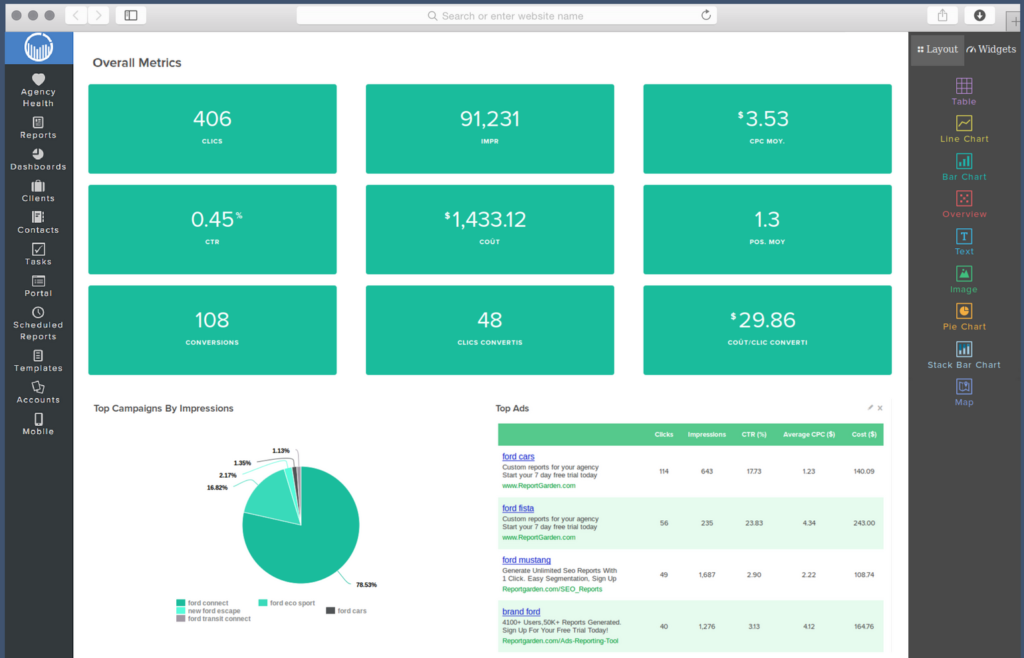
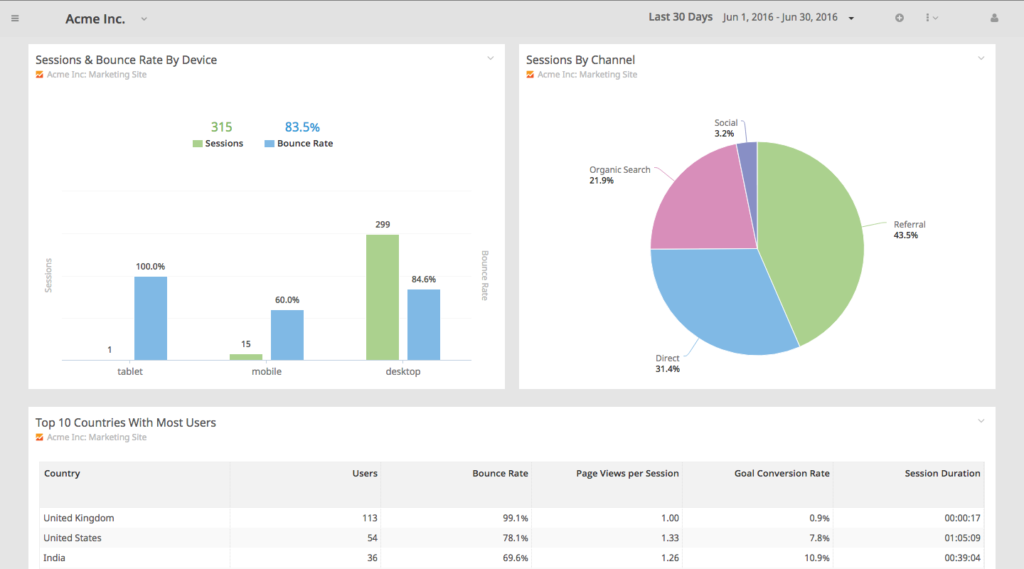
Report Garden utilises a web interface to allow for a wide range of tables and graphs. Part of their focus is to create dashboards you can share with and send to your clients. To get similar functionality to Supermetrics (AdWords, Bing Ads, Facebook Ads) its $169 per month. Which is certainly viable for agencies (as you get 4o user accounts), but likely too expensive for small outfits.
Report Dash has a lot in common with Report Garden. It looks like its less polished, less popular, but more affordable younger brother. It also features a wide range of possible connectors. Plans comparable to Supermetrics start from $79 per month.
Conclusion
Since discovering Supermetrics, it has gone from a useful tool to a “must have” for me. This comes down to a number of factors:
- Manually extracting numbers from different ad platforms is monotonous and error prone. Avoiding this process is a big efficiency and sanity win.
- Sometimes, due to platforms’ slow loading times, it can be tempting to check on metrics each week rather than every few days. But with ALL the metrics going into spreadsheets, it’s very convenient and easy to open them up regularly and check performance.
- It saves valuable TIME each week
For a small business owner like myself, it would be great if there was a more affordable option than $49 per month. Essentially it’s the same cost whether I run one business, or manage a client portfolio of 10+.
But when I calculate the time Supermetrics saves each month (measured in hours rather than minutes), and then calculate it as an hourly rate, it’s a very easy decision to continue using it.
Whilst I use and appreciate Google’s Data Studio, it doesn’t let me pull AdWords, Bing Ads and Facebook Ads automatically all into a single spreadsheet.
So until there’s a competitor which does the job better, this is the tool I use.





Leave a Reply