• Home
  • Blog Categories
    • AdWords
    • Facebook
    • Amazon
    • eCommerce
    • Lead Generation
    • Google Exams
  • Blog Archive

PPC Wins

Tips & strategies for getting the most from your PPC campaigns

SumoMe & Page Speed – How much does SumoMe slow a site?

January 8, 2019 By John King 1 Comment

I’m a big fan of SumoMe’s Scroll Box functionality – it’s a non-invasive method of collecting emails for your site – and I’ve yet to find a good alternative version of it.

Today I was looking at the possibility of adding SumoMe to an Amazon Affiliate niche site I run. But one big conern I have is the affect on page load time. If the page takes too long to load, users will get bored and go elsewhere. Essentially attention spans are low, and need to catered for.

Below I ran some benchmarks on this blog to see how the site loads before and after adding the SumoMe Javascript snippet.

  • In a nutshell, you’re looking at ~594KB extra in page size, and 10 extra external resource requests.

Test 1 – Firefox Browser + London Server

Test 2 – Chrome Browser + Dallas Server

Test 3 – Chrome Browser + Dallas Server (with blog post URL rather than homepage URL)

From my end, what this means is I need to shave off around 594KB in page size & 10 external requests before adding SumoMe.

Otherwise I risk collecting emails, at the expense of losing site visitors due to slower page load.

Amazon PPC Guide for 2019 – How to build and optimize your Sponsored Product ads

June 6, 2018 By John King Leave a Comment

Amazon PPC is great way to boost your products exposure.

The first, initial benefit, is a boost in sales. Allowing you to rank for keywords you wouldn’t otherwise appear for in the search results.

The second benefit, is that these additional sales can boost your Best Seller Rank (BSR) – which can improve your organic rank (and sales).

In this article I’ll be laying out some strategies for how to optimize the way you run your Amazon PPC.

The best way to approach this depends on whether you are setting up your campaigns from scratch, or if you’re already running campaigns.

Building New Campaigns

Begin with Keyword Research

The first thing you will want to do is keyword research. The goal is to create a long list of keywords (phrases) that prospective customers might type into Amazon to find the product you sell.

If you were selling a curcumen supplement. You might start with some keywords such as

  • ‘curcumin pills’
  • ‘high strength curcumin’
  • ‘curcumin 90 caps’
  • etc.

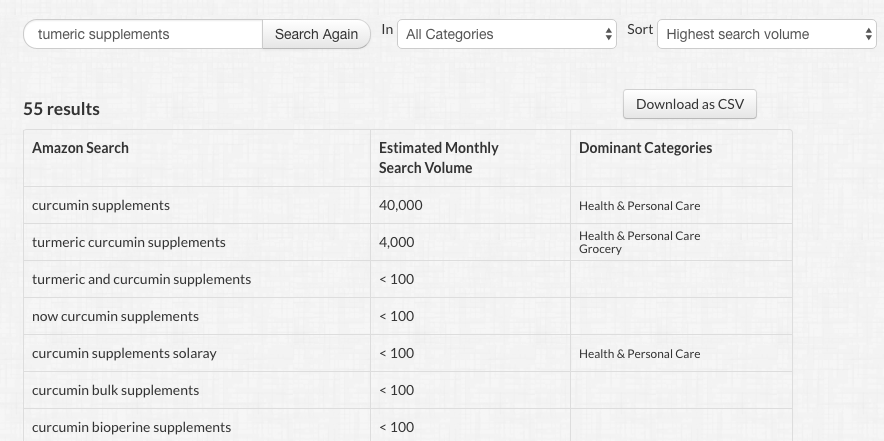
A popular tool for doing Amazon keyword research is Merchant Words.

When you put a search term into Merchant Words, it will offer you a number of related keywords and their search volume. These can be used to help build your keyword list. Bare in mind the keyword search volume figures it presents are not super accurate – just a guideline.

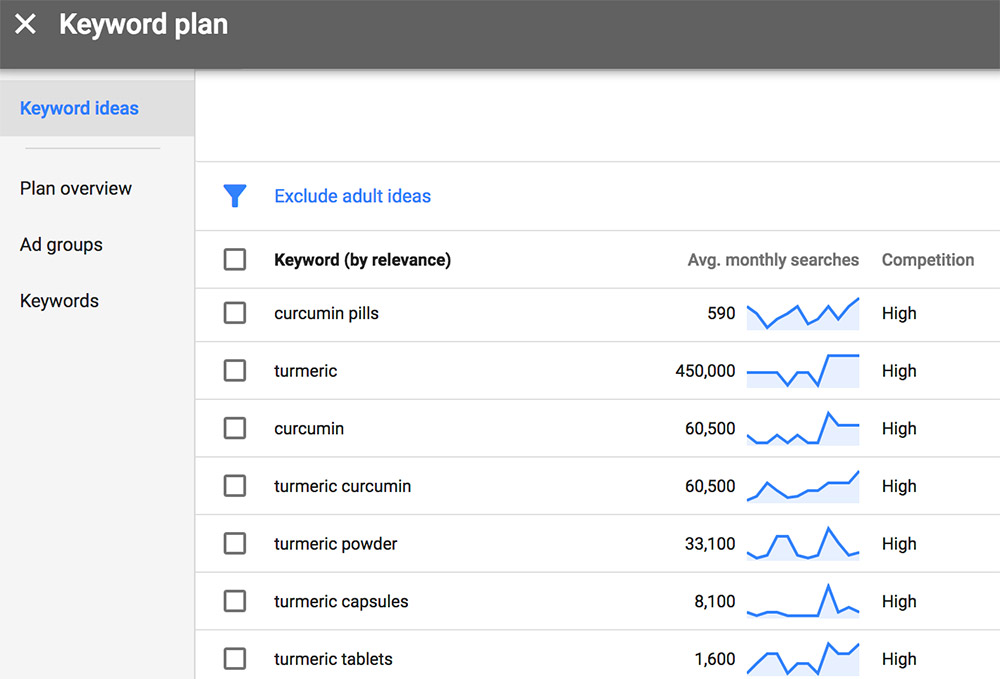
I personally prefer to use Google AdWords Keyword Planner for keyword research. Even though Keyword Planner derives all its data from Google searches (not Amazon), the nice thing is that its data is 100% accurate. Whereas tools like Merchant Words aren’t getting their data directly from Amazon’s servers, therefore its always open to inaccuracies.

One caveat to using Google’s keyword planner is that you need a live, paying account (generally) to get 100% accurate data. On a fresh unused AdWords account the numbers aren’t specific (like below), but instead they’re ranges of figures. For example 100-1000. This isn’t necessarily a deal breaker if you’re just using it for keyword idea generation.

Using Auto Campaigns for Keyword discovery

Auto campaigns are a great tool in your arsenal for keyword research.

Setting up an auto campaign and monitoring the search term report can be a great way to seed new keyword ideas.

When you find a keyword that is converting in the search term report, you can add it as a negative to the auto campaign, and then insert it into a manual campaign where you get full control of the bids.

That way you can keep the bids high and maximize the traffic to that converting keyword.

Manual Campaigns

Whilst auto campaigns are a great form of research. To get the full benefits of keywords, you want be able to tweak their individual bids. With auto campaigns you can only adjust the campaigns overall max cost per click. Therefore the only way to tweak keywords individually is to put your keywords into manual campaigns.

Using your newly researched list of keywords, you can now create new campaigns for your product. These will be in addition to your auto campaigns.

Structuring your campaigns

Perhaps contrary to what others may say, I don’t think there is one single “right way” to structure your Amazon Sponsored Product campaigns. Examples of structure include:

  1. Creating 3 campaigns per product variant, targeting EXACT, PHRASE & BROAD match keywords
  2. Creating 3 campaigns per product, targeting EXACT, PHRASE & BROAD match keywords
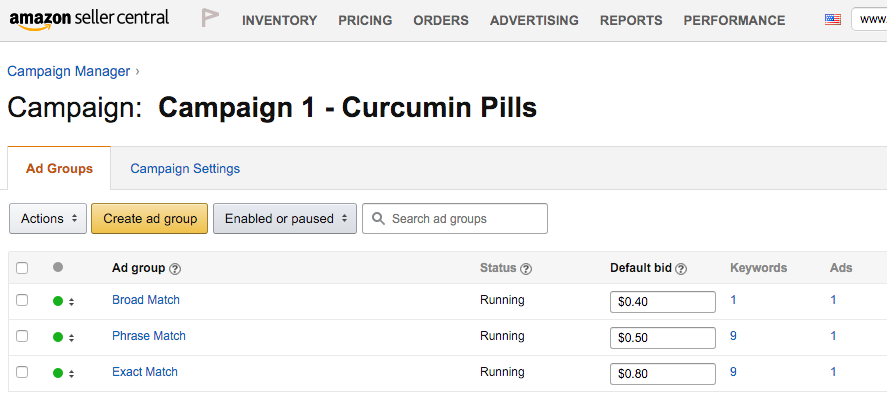
  3. Creating 1 campaign per product, and create 3 ad groups targeting EXACT, PHRASE & BROAD match keywords
  4. Create campaigns based on keyword “categories”

So for example, scenario number 1 would be the most granular approach, and scenario number 3 is the least granular. In theory, scenario number 1 is better, but only if each campaign gets optimization attention it needs.

It’s also possible that going too granular on campaign segmentation can result in information overload. Which could actually work against us, if we don’t spend enough time to run through each individual campaign and tweak the bids.

The other variable to throw into the equation is details of the product that you’re selling. One person may have a product that has highly similar variations; and thus it’s more logical to place them together in one campaign. Another person may have products with very different product variations (or variations that perform v. differently), that each absolutely need their own campaign.

Lastly, in scenario number 4 (above), if you already know that different categories of keywords perform differently, you may benefit from splitting them into different campaigns.

So that’s my rationale for not evangelising one single structure as being the very best. All that being said, if you’re just starting out, I’d suggest picking either #1 or #2 in the above list.

Keyword Types

Amazon offer us 3 different match types for our keywords. Lets explore these in more detail:

EXACT Match Keywords
The exact match type is where you eventually want to place all your top keywords. If you had “curcumin extract” in exact match, it means the keyword would only get triggered for an impression when someone searches exactly for “curcumin extract”. Searches such as “curcumin extract powder”, “extract curcumin” etc. wouldn’t trigger the keyword. The benefit with exact match keywords is it gives you the highest level of granularity for your keyword level bid adjustments.

-> Exact match campaigns should have the highest keyword bids.

PHRASE Match Keywords
If we were to take the above example, “curcumin extract”, and put it into phrase match. All of a sudden it will trigger for keywords such as “curcumin extract powder” and “high strength curcumin extract”. Essentially, as long as the two keywords appear in order next to each other in a sentence, then the keyword will be triggered.

This is the second most granular type of keywords, and is great as a “catch all” mechanism for picking up keyword variations we might not have thought of.

-> Phrase match campaigns should have the next highest keyword bids (after exact)

BROAD Match Keywords
The least granular of the keywords, this category is useful for keyword discovery, by tapping into synonyms, misspellings or variations of the keyword. The issue with broad match is its wide net can drive up campaigns ACOS. Therefore it’s often something you want to run at the start of a PPC campaign, to learn new keywords. But then later pause it if it gets too expensive.

-> Broad match campaigns should have the lowest keyword bids
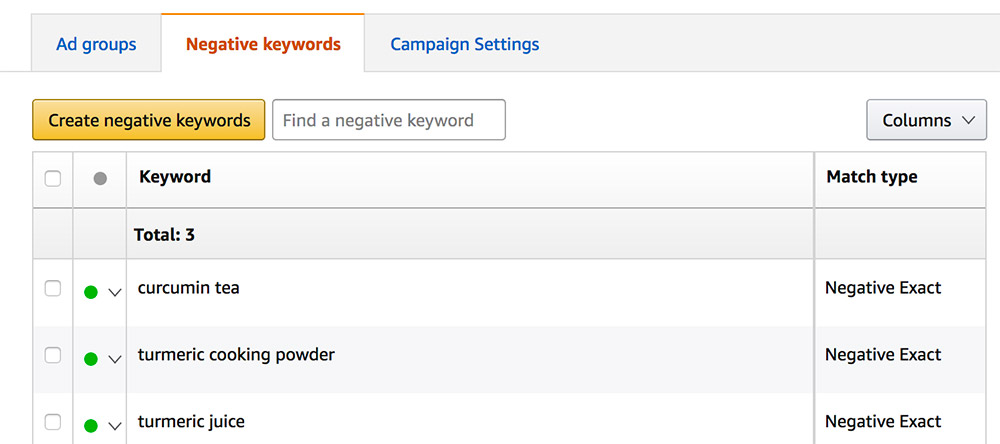
NEGATIVE Keywords
Negative keywords can be added at an ad group or campaign level. These are not useful for exact match campaigns, but for the rest of the match types, they are very valuable for filtering out keywords that either don’t convert, or convert at a high cost. Further down this post we discuss “search term report analysis”, which is the tool you need to pick up search terms that are wasting spend, and add them as negatives. You can choose between “negative phrase” and “negative exact”. Phrase is good when you want to really eliminate all presence of a word, and “negative exact” is good when you might want that keyword, but in another formulation.

Below is an example of #4 (above), where campaigns are split out by keyword theme.

amazon-ppc-setup

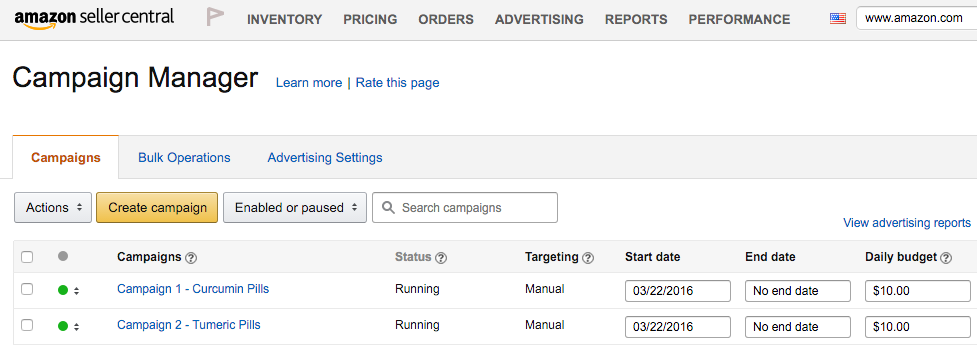
Then within each campaign, you might have three ad groups for each match type:

amazon-ppc-strategy

Budgeting

Daily Budget
Initially when you’re building your campaigns you’ll want to set conservative daily budgets. This is necessary until you have an idea of what the campaigns average ACOS is. Something in the range of $10 to $50 per campaign is reasonable to start off with. This can later be raised if you are comfortable with the campaigns ACOS.
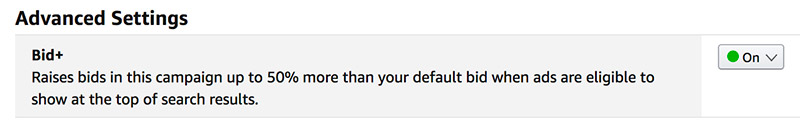
Bid+
This is a setting that will raise your keyword bids by up to 50% when there’s a chance of you appearing at the top of the search results. The sceptical part of me says this is an opportunity for Amazon to grab more money from you. I would only advise using this setting for campaigns where the ACOS is already favourable.

Optimizing Campaigns

Once you’ve run some traffic to your campaigns, and gathered some click data, you can start to analyse your traffic via the keyword reports.

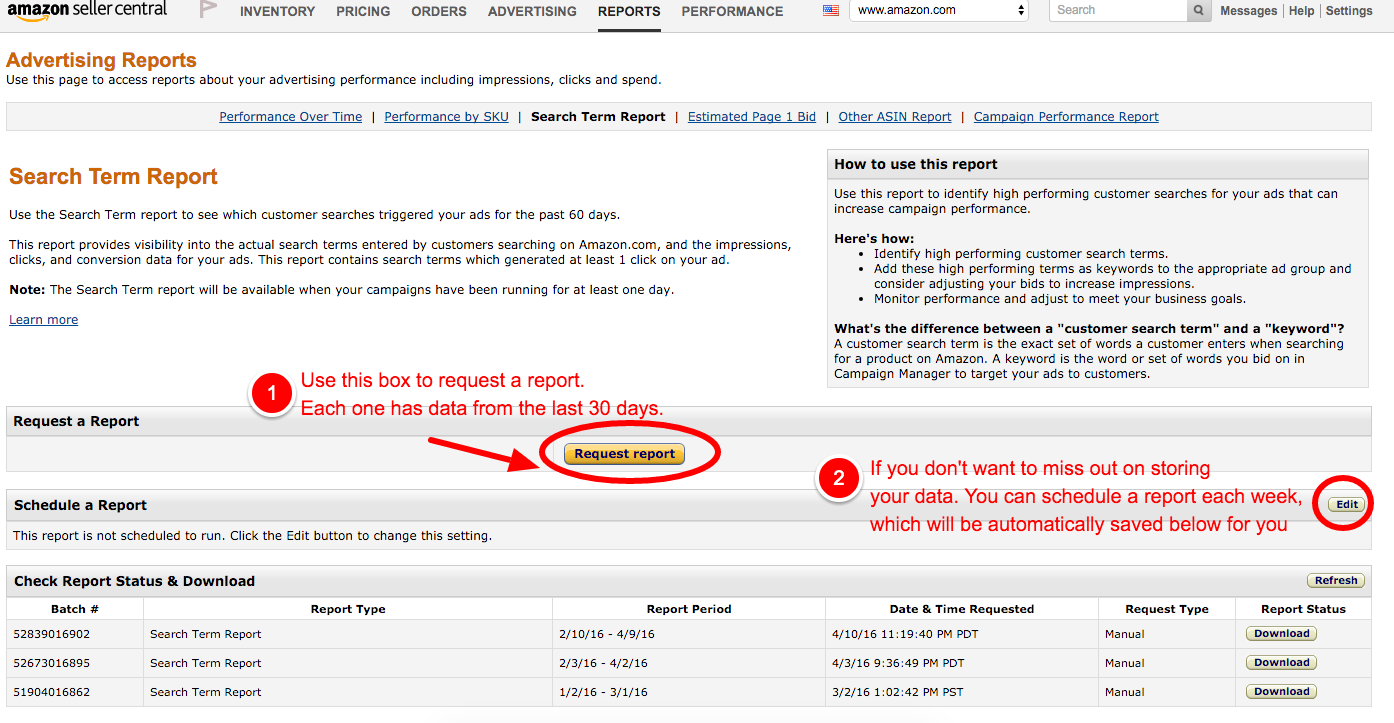
To do this, you want to visit the Search Term Report:

search term report edit

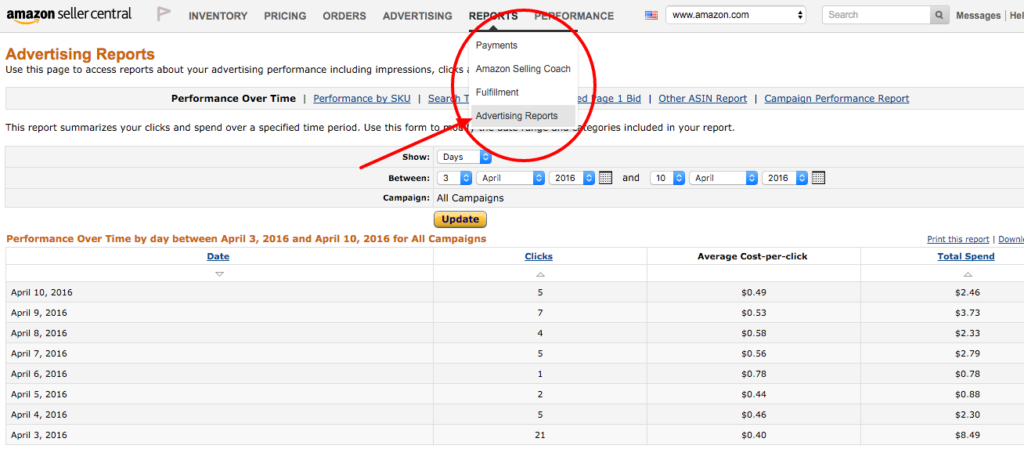
And then select the ‘Search Term Report’ link:

aws

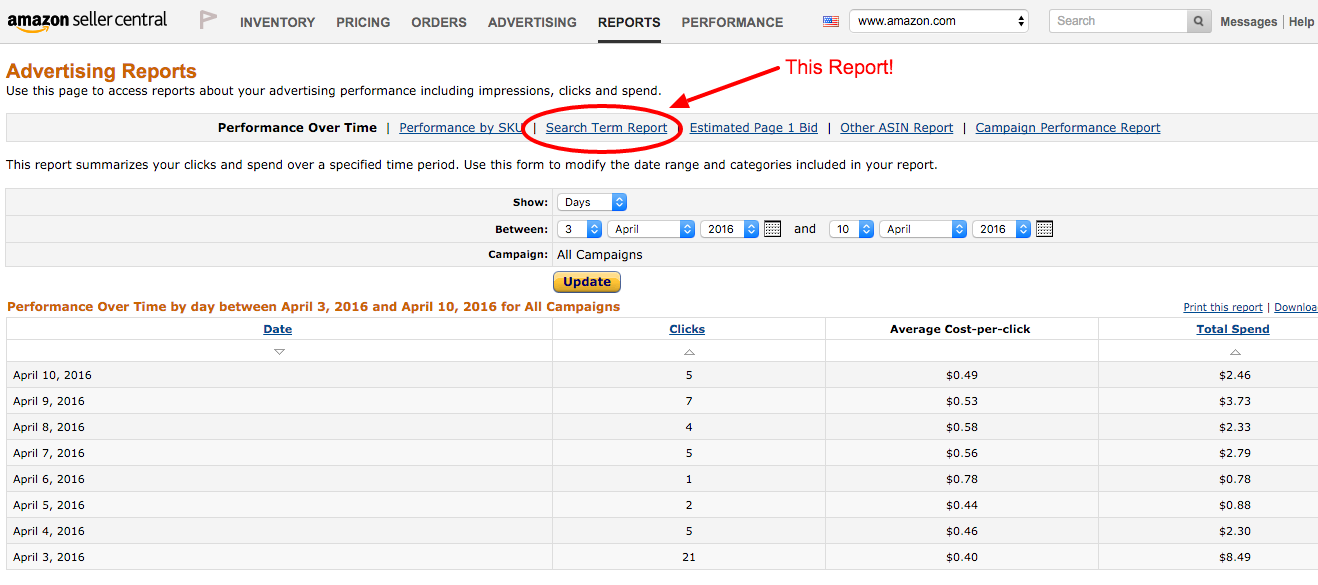
Below is some information on how the Search Terms report dashboard works:

amazon-ppc-search-term-reports

Once you have a copy of your search term report you can open it within a spreadsheet application such as Excel, add some filters to the headings, and start analyzing it.

At which point there are a number of things you’ll want to do:

  • Calculate your max ACoS (if you don’t know it already) – and setup conditional formatting to highlight any rows that go above this. This tells you which search terms are not currently profitable. For more info on ACOS; see my post here.
  • Sort by ‘orders placed within 1  week of a click’ to see which search terms are driving the most sales
  • Then create two different lists – one for search terms that drive sales and are below your max ACoS to add in exact match. Specifically terms that you’re not already targeting. So you’d be looking at ‘customer search term’ rather than ‘keyword’, and you’d want to filter out your Exact Match campaigns or ad groups. Then another list for search terms that aren’t profitable – which you’ll later consider adding as negatives.

More Advanced (ish) Optimization Strategies

Separate high volume keywords into their own campaigns

Often you will find that there are a small number of exact match keywords that drive the vast majority of your PPC traffic. For example, if you’re selling Curcumin Pills, you may find that “curcumin supplement” is one of your top keywords. The downside to these types of high volume keywords is that, due to the competitiveness, often their ACOS is also quite high. Leaving them active inside your main campaign can often result in them maxing out your daily budget, which at the same time pauses the profitable keywords with low ACOS.

In this situation, you may opt to move the high volume keywords into their own campaign, giving them a separate budget. When their daily budget gets maxed out, they pause, but it doesn’t affect your other keywords running on separate daily budgets.

For keywords that already rank #1 or #2 organically, test switching off PPC on those keywords

You may have a small number of keywords where you already rank #1 or #2. Running PPC on these keywords can be a good thing, because it will increase your presence on the search page. However, the downside is that you may spend a lot on PPC, because the paid ads often come before the organic results. If you feel that PPC spend is getting too high, it can be worth pausing these PPC keywords as a test. If it results in a noticeable drop in sales, it may be necessary to re-enable the PPC keywords.

Lower PPC budgets when stock runs low

During periods of low inventory, you may wish to lower budgets to restrict the volume of sales generated and prevent an out of stock situation. Lowering budgets is generally regarded as a better approach than reducing bids or pausing campaigns.

Consider running PPC at a loss during product launch

Generally speaking, it’s best to target an ACOS that leaves you with enough margin to still make profit on sales. However, during a product launch it can be worth over spending in order to drive sales, and hopefully, improve your Best Seller Rank. It’s worth noting however that in 2018, Amazon’s search ranking algorithm no longer gives as much weight to PPC sales as it did in prior years. Therefore, to supplement this product launch strategy, you will want to also drive sales from external websites. Sales from external traffic in 2018 plays a bigger role in the ranking algorithm than it used to.

Closing Words

So that’s a high level overview of the key steps you need to take when setting up and optimizing Amazon PPC campaigns. Let me know if it helps, and if you have any further questions in the comments.

Get Google Shopping Stars FREE for your eCommerce Store (Aka Seller Ratings)

September 18, 2017 By John King Leave a Comment

Hey folks! Want to share some exciting news for eCommerce owners.

Google recently opened up a program called ‘Customer Reviews’. It allows store owners to collect customer reviews, which can later be used as ‘seller ratings’.

Allowing you to show “stars” in your ads, like this:


And also, allowing you to show stars in the Google Shopping comparison, to build social proof that you are a trustworthy seller:

On top of that… Google also let you add a reviews widget on your site, so you can show off to prospective customers (assuming you have a good star rating!). The badge looks like this:

This program has been live for a while. But if you had your store on Shopify you could only use it if you upgraded to Shopify Plus. This was down to a stipulation by Google that your checkout pages had to be on your domain. Until recently, all Shopify checkout URLs were on the Shopify domain (checkout.shopify.com). Fortunately they recently changed this, and your store should have its own domain in the checkout URL (you can confirm this by adding something to the cart, and seeing what the URL is when you go to checkout).

If your checkout URL is your domain; you’re good to go!

So how do you set this up?

For the self learners, here’s the Google instructions for how to implement:
https://support.google.com/merchants/answer/7124018

Come back to this post if you’re using Shopify, and want a list of the liquid variables to use.

Here’s are the basic initial steps:

  1. Create and/or log in to your Google Merchant centre account
  2. Ensure your Merchant Center account is verified and claimed
  3. Click the 3-dot icon dropdown in the upper right corner
  4. Select Merchant Center programs from the dropdown menu options
  5. From the Merchant Center programs page, navigate to the Google Customer Reviews card
  6. Click Get started to sign up
  7. Agree to Google Customer Reviews program agreement
  8. Check that Google Customer Reviews appears in your account

Next, for the code we need to add:

<!-- BEGIN GCR Opt-in Module Code -->
<script src="https://apis.google.com/js/platform.js?onload=renderOptIn"
  async defer>
</script>

<script>
  window.renderOptIn = function() { 
    window.gapi.load('surveyoptin', function() {
      window.gapi.surveyoptin.render(
        {
          // REQUIRED
          "merchant_id":"MERCHANT_ID",
          "order_id": "ORDER_ID",
          "email": "CUSTOMER_EMAIL",
          "delivery_country": "COUNTRY_CODE",
          "estimated_delivery_date": "YYYY-MM-DD",

          // OPTIONAL
          "opt_in_style": "OPT_IN_STYLE"
        }); 
     });
  }
</script>
<!-- END GCR Opt-in Module Code -->

Next, we need to replace all the capitalized values that are surrounded by “<” and “>” characters.

Some of these will feature fixed values, and some will need dynamic values.

How to fill these out:

Variable Required? Description
MERCHANT_ID Required Your Merchant Center ID. You can get this value from the Google Merchant Center.
ORDER_ID Required A unique ID for the order. Will need a dynamic code if you’re using something like Shopify/Magento/BigCommerce
CUSTOMER_EMAIL Required The customer’s email address, in the format [email protected].
COUNTRY_CODE Required The two-letter country code identifies where the customer’s order will be delivered. This value must be in ISO 3166-1 alpha-2 format. For example, “US”.
YYYY-MM-DD Required The estimated delivery date for the order, where YYYY is the year, MM is the month, and DD is the day. For example, “2016-09-13”.
OPT_IN_STYLE Optional Specifies how the opt-in module’s dialog box is displayed. Possible values are:

  • “CENTER_DIALOG”: Displayed as a dialog box in the center of the view.
  • “BOTTOM_RIGHT_DIALOG”: Displayed as a dialog box at the bottom right of the view.
  • “BOTTOM_LEFT_DIALOG”: Displayed as a dialog box at the bottom left of the view.
  • “TOP_RIGHT_DIALOG”: Displayed as a dialog box at the top right of the view.
  • “TOP_LEFT_DIALOG”: Displayed as a dialog box at the top left of the view.
  • “BOTTOM_TRAY”: Displayed in the bottom of the view.

The default value is “CENTER_DIALOG”.

Code for Shopify:

Code to Replace Shopify Snippet to Use
ORDER_ID {{order.name}}
CUSTOMER_EMAIL {{customer.email}}
COUNTRY_CODE {{shipping_address.country_code}}
YYYY-MM-DD {{ order.created_at | date:’%s’ | plus:604800 | date:”%F” }}

For the YYYY-MM-DD option – where you want to record the estimated shipping time. The Shopify code above basically sets a time (in this case 604800 seconds, or in other words, a week) since the date of the order. There’s 86400 seconds in a day, so you can base off that number to get a time accurate for your store.

For example, adding 5 days after order creation would look like:
{{ order.created_at | date:’%s’ | plus:432000 | date:”%F” }}

All this code needs to be added to the Shopify Admin, under Settings > Checkout > Additional Scripts.

One key thing to check is that the quotes are in plain text. Quite often when copying them, the single quotes need retyping. If they’re not in plain text, it could break the JS code. The error below is an example of a (likely) copy and paste issue:

Confirm its working by viewing the page source on one of your checkout page URLs. If you’re using AdWords conversion tracking, or a Facebook ads pixel, you should be able to retrieve a checkout URL from there. Alternatively, create a dummy order, and save the checkout URL from that.

Additionally, check the javascript by opening Console in Google Chrome’s Inspector tool.

Once you have enough reviews, you can then proceed to add the reviews badge/widget to your page using these instructions.

If someone knows the equivalent dynamic variables for Magento, BigCommerce or any other major eCommerce platform, please add it in the comments :)

How to Track ROAS in AdWords (Return on Ad Spend)

May 7, 2017 By John King Leave a Comment

This is a quick post to cover ROAS in Google AdWords. When it comes to selling things on AdWords, there’s two things you really want to optimize for, sales volume, and return on ad spend. You want to get as many sales as possible (volume), but you want to do so whilst spending as little as possible (where ROAS comes in).

Another popular metric to track is cost per conversion (aka cost per acquisition (CPA)). The problem with this metric, is that it doesn’t differentiate between big orders and small orders.

If one month, I get a lower overall CPA than last month, but each order is for a small amount, I haven’t really won. ROAS takes into account every cent of each sale.

So how do we go about tracking this?

Firstly, its imperative to ensure your conversion tracking is setup correctly, and recording the conversion value of each sale. You want to make sure you’re dynamically adjusting the conversion value section based upon the eCommerce software you’re using. And you want also want to ensure you’re not recording any duplicate conversions.

If you’re on Shopify, check out my guide for how to do this.

After that, its simply a case of adding the correct column to your AdWords dashboard. The column is named “Conv. value / cost”.

The output that you’ll see from this column will be something like “5.21”. And the way to understand it, is that it refers to the number of dollars (or the currency unit you’re using) returned for each dollar of AdWords spend. In this example, it would be $5.21 dollars returned, for each dollar spent. Higher = better. Lower = worse.

Example of the column used in AdWords

Supermetrics Review – Save Time Analyzing & Reporting on Your PPC Campaigns

March 20, 2017 By John King Leave a Comment

Supermetrics can be an incredibly useful tool for both account management and client reporting. It’s a very time efficient way to compile all your marketing data into Google Sheets, and monitor performance at a glance. In this article I’m going to run through the why and how of Supermetrics.

I began using Supermetrics about 2 years ago, for a variety of reasons:

  • Needed one place I could view all my marketing campaign results (Bing Ads, Facebook Ads, and of course, AdWords). Why? Because loading each platform individually is painfully slow. When you factor in time taken to setup the correct data view you want.
  • Wanted to be able to define a number of different views simultaneously. Specifically the current months performance + year to date performance. All while comparing with YoY data to see long term performance trends. This important to business owners when they are seeking to get growth in their business.
  • Lastly, not only would this data be useful for at a glance performance management, I wanted to use it for reporting purposes also.

Intro to how Supermetrics works

Supermetrics runs within Google Sheets, and allows you to pull data from all the top ad platforms. You can pull the data in a variety of formats:

  • Specific time periods
  • Compared with YoY metrics
  • Using filters to track specific campaigns or data segments

And then you can manipulate the data in whatever way best suits your metrics. Using all the regular spreadsheet tools you’re used to (formulas, conditional formatting, pivot tables, etc)

The “cool” thing about Supermetrics running within Sheets as opposed to Excel, is that you can schedule sheets to update at multiple times during the day. That way, when you check your metrics, they’re never far from the real-time data. Which wouldn’t be possible if the plugin used regular Excel.

Who’s it for?

Supermetrics is for those who want to pull ad data from multiple sources (AdWords, Bing, Facebook etc) and be able to view the metrics all in one place. You could be an individual who likes to keep strict tabs on his performance, or you could be an agency managing multiple accounts, and wants to save time and streamline account analysis and reporting.

You can certainly replicate this kind of thing manually, but it comes at a time cost that may be unacceptable.

Integrations available:

So far I’ve only used 3 integrations (Google Ads, Facebook & Bing), but there are much more available. The main ones being:

  • Google Ads
  • Facebook Ads
  • Bing Ads
  • Instagram
  • Google Analytics
  • YouTube
  • DoubleClick
  • Twitter Ads
  • Pinterest
  • Stripe
  • Mailchimp
  • Moz, SEMRush, Yahoo Gemini

And its this flexibility, that makes it a swiss army knife for crunching numbers, building dashboards and doing reporting.

How it works within Google Sheets

To install the add on for Google Sheets, navigate to the Supermetrics site, and hit the red “try for free” button. This will take you to the Chrome web store, where you can install the plugin. Once installed, you will see Supermetrics as an option within Add Ons:

There’s a few options in here. The one we want to kick things off is Launch Sidebar. Click that, and you’ll see a sidebar that looks like the following:


And its this dialog box that gives you the options to configure how you display data. To get something really useful, you need to setup a number of different tables for data. That allows for different time periods and data sources.

Here’s an example of the Supermetrics workflow:

How I use it for eCommerce PPC reporting

Here is an example of a dashboard that I use for an eCommerce client. Its a reasonable demonstration of how much data is being pulled and manipulated. Rather than pulling directly from Supermetrics into this spreadsheet, I pull into separate sheets for each data source (to keep things “clean”), and then reference those cells in this sheet.

Example Supermetrics Dash. Worth noting that the green/red highlighting isn’t a SM feature, instead you can achieve this through ‘conditional formatting’ built into Sheets.

Supermetrics Templates Gallery

The above example is very specific to a certain type of client with certain types of goals (YoY eCommerce growth). However, for example with a lead generation campaign, you might build something quite different.

In addition to building reports from the ground up, you can also construct them from Supermetrics’ template gallery. You simply select the template you want to use, add your data source (AdWords, Facebook or Bing), and the view gets dynamically built out in seconds.

These can be seen as a “step 1” if you’re unsure where to begin with Supermetrics. Or for more advanced users, it can be a time-saving feature to access greater reporting granularity.

The below video demos a few of the templates I’ve found useful:

Supermetrics Alternatives?

Initially when Supermetrics was released it was a free tool, and has gradually become more expensive. At the latest renewal period I took a look around to see if there was a better (perhaps more affordable?) alternative.

When I started looking into the alternatives, I noticed that most work within a web interface, rather than through a spreadsheet. This has its pros and cons. The pros hinge largely on the ability to provide great visualisations of data. Nice graphics and colors for example. The cons relate largely to customisation. Whilst it’s possible to have infinite customisation within a web interface, the practicality thus far was that they’re mostly limited to a fixed set of configurations.

Personally I need to be able to customise the data that’s being shown. For example, with some clients they have legacy conversion data that is inaccurate (from issues with conversion tracking pixels), so I need to be able to make manual adjustments such that their data is accurate. And there further examples I could go into where the flexibility of spreadsheets is v. much welcomed.

There was one alternative, called Analytics Edge, that works within a spreadsheet. My issue with this one was that it uses Excel, rather than Google Sheets. The upside to using a cloud based System like sheets, is that you can set it to auto-refresh at different points during the day/night. That way, when you open the sheet, the data is already relatively up to date.

So with this in mind, I’ve just included a cursory overview of the alternatives below:

Analytics Edge

As mentioned above, Analytics Edge is an Excel plugin similar to Supermetrics. Its $75 per year, with an extra $50 for each “connector”. It offers connectors such as Bing, AdWords, Facebook and more. Whilst relatively cheap from the offset, it can add up if you require a lot of connectors.

Report Garden

Report Garden utilises a web interface to allow for a wide range of tables and graphs. Part of their focus is to create dashboards you can share with and send to your clients. To get similar functionality to Supermetrics (AdWords, Bing Ads, Facebook Ads) its $169 per month. Which is certainly viable for agencies (as you get 4o user accounts), but likely too expensive for small outfits.

Report Dash

Report Dash has a lot in common with Report Garden. It looks like its less polished, less popular, but more affordable younger brother. It also features a wide range of possible connectors. Plans comparable to Supermetrics start from $79 per month.

Report Dash Screenshot

Conclusion

Since discovering Supermetrics, it has gone from a useful tool to a “must have” for me. This comes down to a number of factors:

  • Manually extracting numbers from different ad platforms is monotonous and error prone. Avoiding this process is a big efficiency and sanity win.
  • Sometimes, due to platforms’ slow loading times, it can be tempting to check on metrics each week rather than every few days. But with ALL the metrics going into spreadsheets, it’s very convenient and easy to open them up regularly and check performance.
  • It saves valuable TIME each week

For a small business owner like myself, it would be great if there was a more affordable option than $49 per month. Essentially it’s the same cost whether I run one business, or manage a client portfolio of 10+.

But when I calculate the time Supermetrics saves each month (measured in hours rather than minutes), and then calculate it as an hourly rate, it’s a very easy decision to continue using it.

Whilst I use and appreciate Google’s Data Studio, it doesn’t let me pull AdWords, Bing Ads and Facebook Ads automatically all into a single spreadsheet.

So until there’s a competitor which does the job better, this is the tool I use.

Next Page »

Popular Posts

First Time Here?

Hey and welcome to the site.

PPC Wins is a site dedicated to sharing with you useful tips and advice for getting the most out of PPC campaigns.

If there is a topic you would like to see covered please get in contact.

Categories

  • AdWords
  • Amazon
  • eCommerce
  • Facebook
  • Google Analytics
  • Google Exams
  • Lead Generation
  • Uncategorized
google-adwords-certified-partner2
BingAds_Accredited_Badge (1)

Copyright © 2022 ppcwins.com